Turbulence Forecasts
Turbulence Forecasting
We have developed an optical turbulence forecast tool which can be used to in two ways:
- Post-process archived meteorological data in order to develop statistics for any particular site of interest.
- Use with forecast meteorological parameters (temperature, pressure, wind speed etc) to forecast the turbulence strength in at site over the next few hours or days.
The tool is based on meteorological data and can be used with, for example ECMWF data. The model is global and is fast, enabling us to process large volumes of data in a short period.
Access to the forecast
To access the forecast please contact me.
Details
Often, standard atmospheric models, such as the Hufnagel-Valley (Andrews, Phillips, & Young, 2000) are used in the community. However, these static models are designed to give realistic integrated atmospheric parameters and are not specific to any location. An alternative is to use measurement campaigns or small-spatial scale (meso-scale) simulations (see for example (Basu, Osborn, He, & DeMarco, 2020; Cherubini, Businger, & Lyman, 2008; Giordano et al., 2013; Masciadri, Lascaux, Turchi, & Fini, 2017)) to estimate the turbulence above the site.
These both have the advantage of capturing the dynamics of the turbulence. However, measurement campaigns give a snapshot of conditions at a particular location and over a limited time-frame but this is unlikely to give statistically complete results and meso-scale simulations are slow to run and therefore not suitable for global coverage or processing long-term datasets in order to assess performance variability.
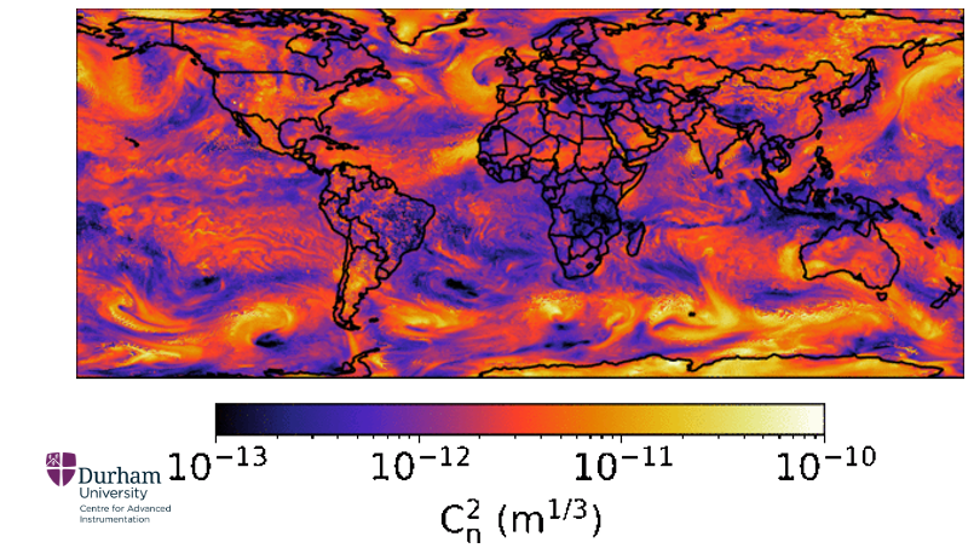
Here, we present a new global turbulence model capable of converting global meteorological re-analysis models into 3-Dimensional quantitative optical turbulence maps. Although not as accurate as the meso-scale models or on-site measurements, the low computational load means that global estimates can be calculated rapidly. This is based on the model of Osborn & Sarazin (J Osborn & Sarazin, 2018) but improved to include a separate boundary layer and a more rigorous free-atmosphere model. The previous model was limited to weak turbulence conditions (i.e. night-time at astronomical observatories) and does not work in stronger boundary layer conditions (i.e. day time). These developments are significant as they enable stronger turbulence strength near the ground to be modelled and therefore provides a better estimate of global turbulence strength during the day and night.
This model can be used with historical archived meteorological data in order to mine statistical information on the Earth’s atmospheric turbulence. This will enable a first estimate of the performance of optical systems anywhere in the world, enabling efficient site selection, instrument design and operational procedures, including the development of innovative turbulence mitigation solutions
We use the European Centre for Medium Range Weather Forecasts (ECMWF) ERA-5 reanalysis dataset as an input to the turbulence model. The ECMWF ERA-5 provide model level meteorological re-analysis datasets. The datasets used here have 0.3 degree spatial resolution (equivalent of a few tens of kilometres depending on latitude).